Share this
![]() Richard Verhoeff
on Jul 13, 2021 15:25
| Updated: Jan 22, 2026 15:33
Richard Verhoeff
on Jul 13, 2021 15:25
| Updated: Jan 22, 2026 15:33

It’s time to make your data work for you! I will show you how to build a data monetisation strategy that leverages your company’s data to open new revenue opportunities. Every company operates on data, but most companies don't know how to make data monetisation successful. Data monetisation pays off, in this blog I will give you examples of how companies use data to make profits. I will focus on generating extra revenue streams as a new business model. I won’t focus on the financial effects of process improvements, cost cutting, customer segmentation etc. which also can be achieved as a result of data analytics.
Monetise data to grow revenue
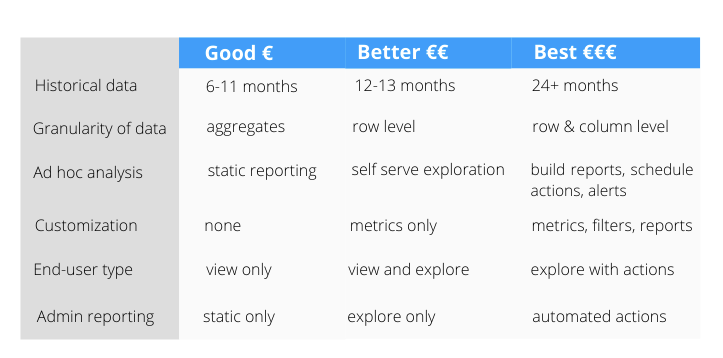
You can explore how to monetise your embedded analytics offering. For example, offer a tiered plan that looks something like this:
- Basic Tier
- View preset reports within a limited dataset date range (example: last six months)
- Advanced Tier
- Basic + the ability to drill down, download, and schedule reports and see 12 months of data
- Premium Tier
- Advanced + Ability to explore, save, and share content with other team members and see data for all time ranges
- Access to support team, custom report building
Crucially, it is about understanding which features and which datasets truly offer value to the end user and then pricing accordingly.
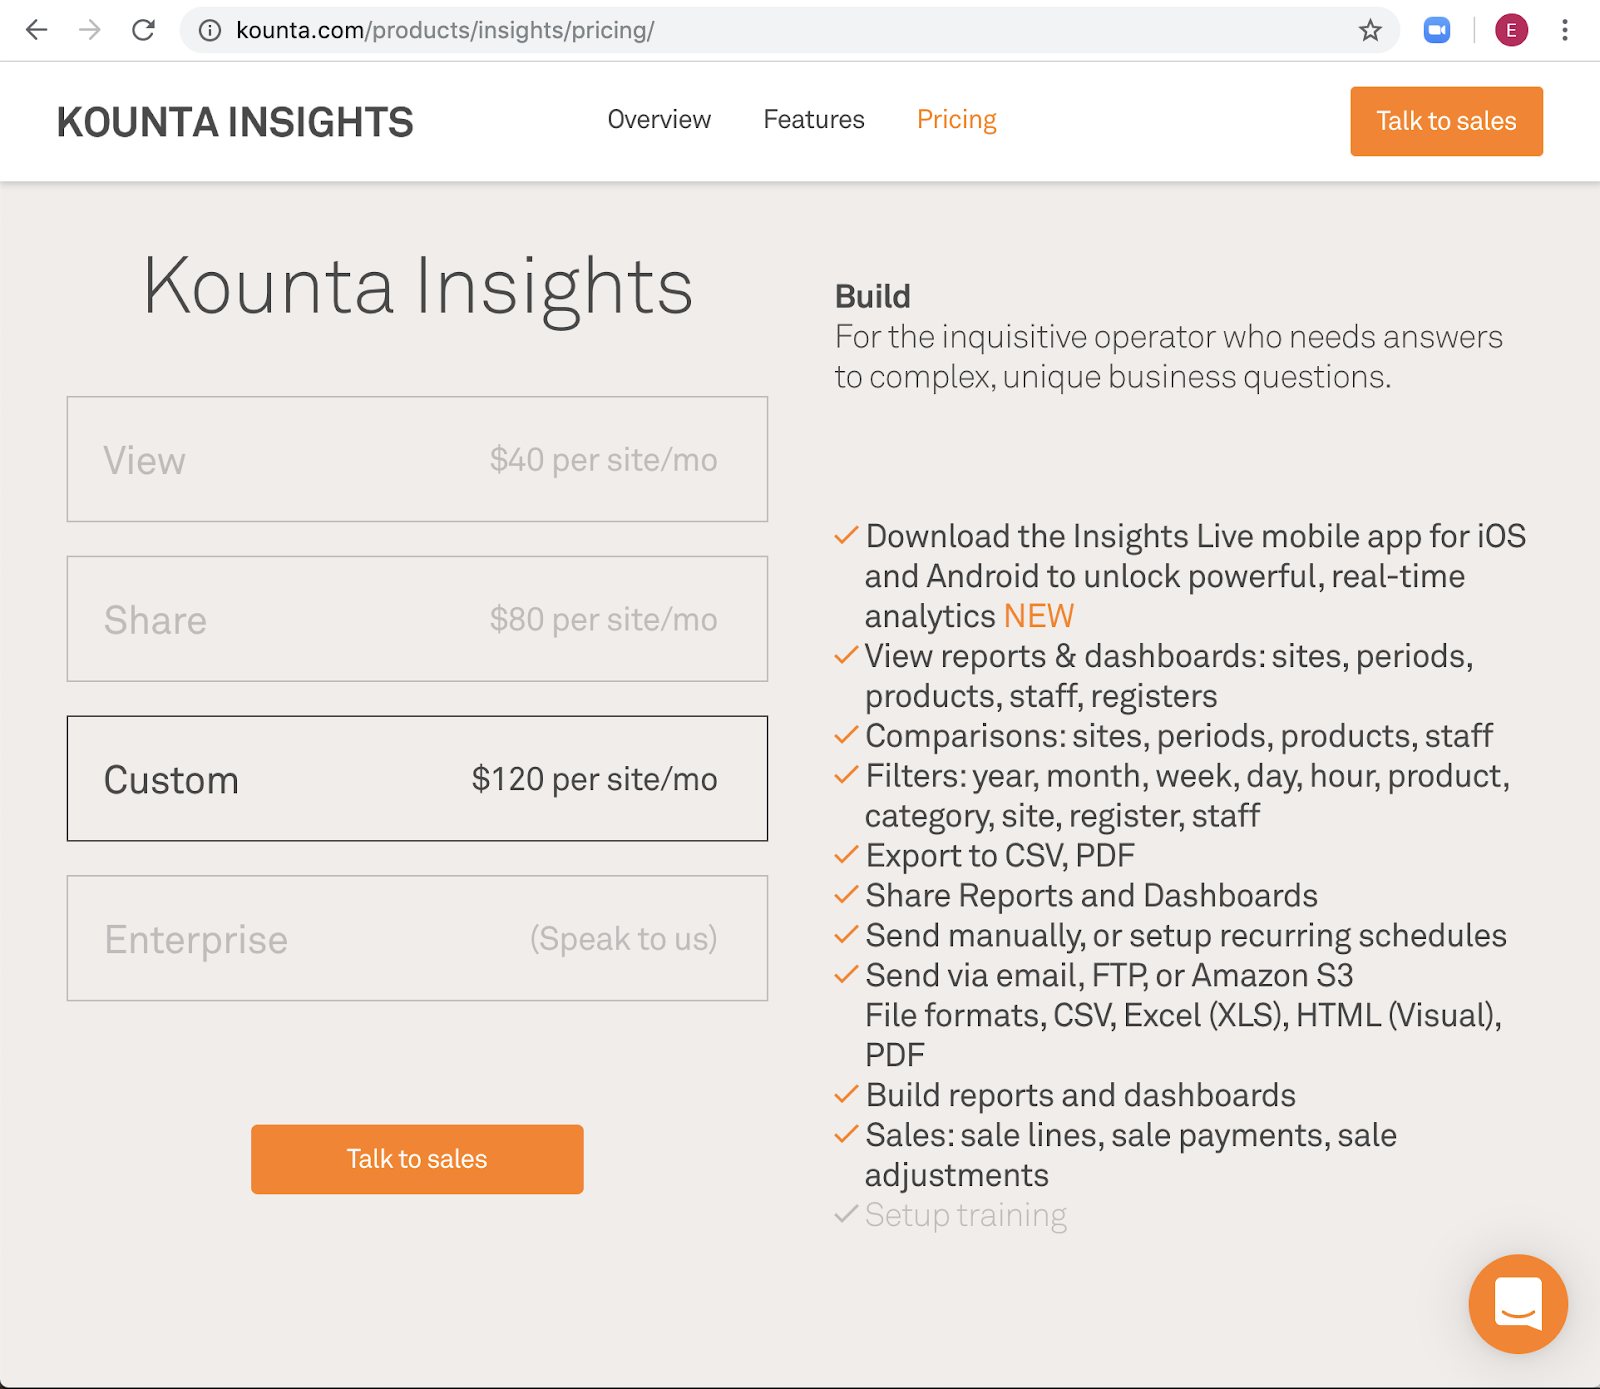
Kounta is a B2B Fintech company that makes Ipad Point Of Sale applications in the foodservice market. They have price analytics in premium tiers for foodservice companies such as restaurants to drive upgrades, delivering differentiated value across 4 premium tiers of service.
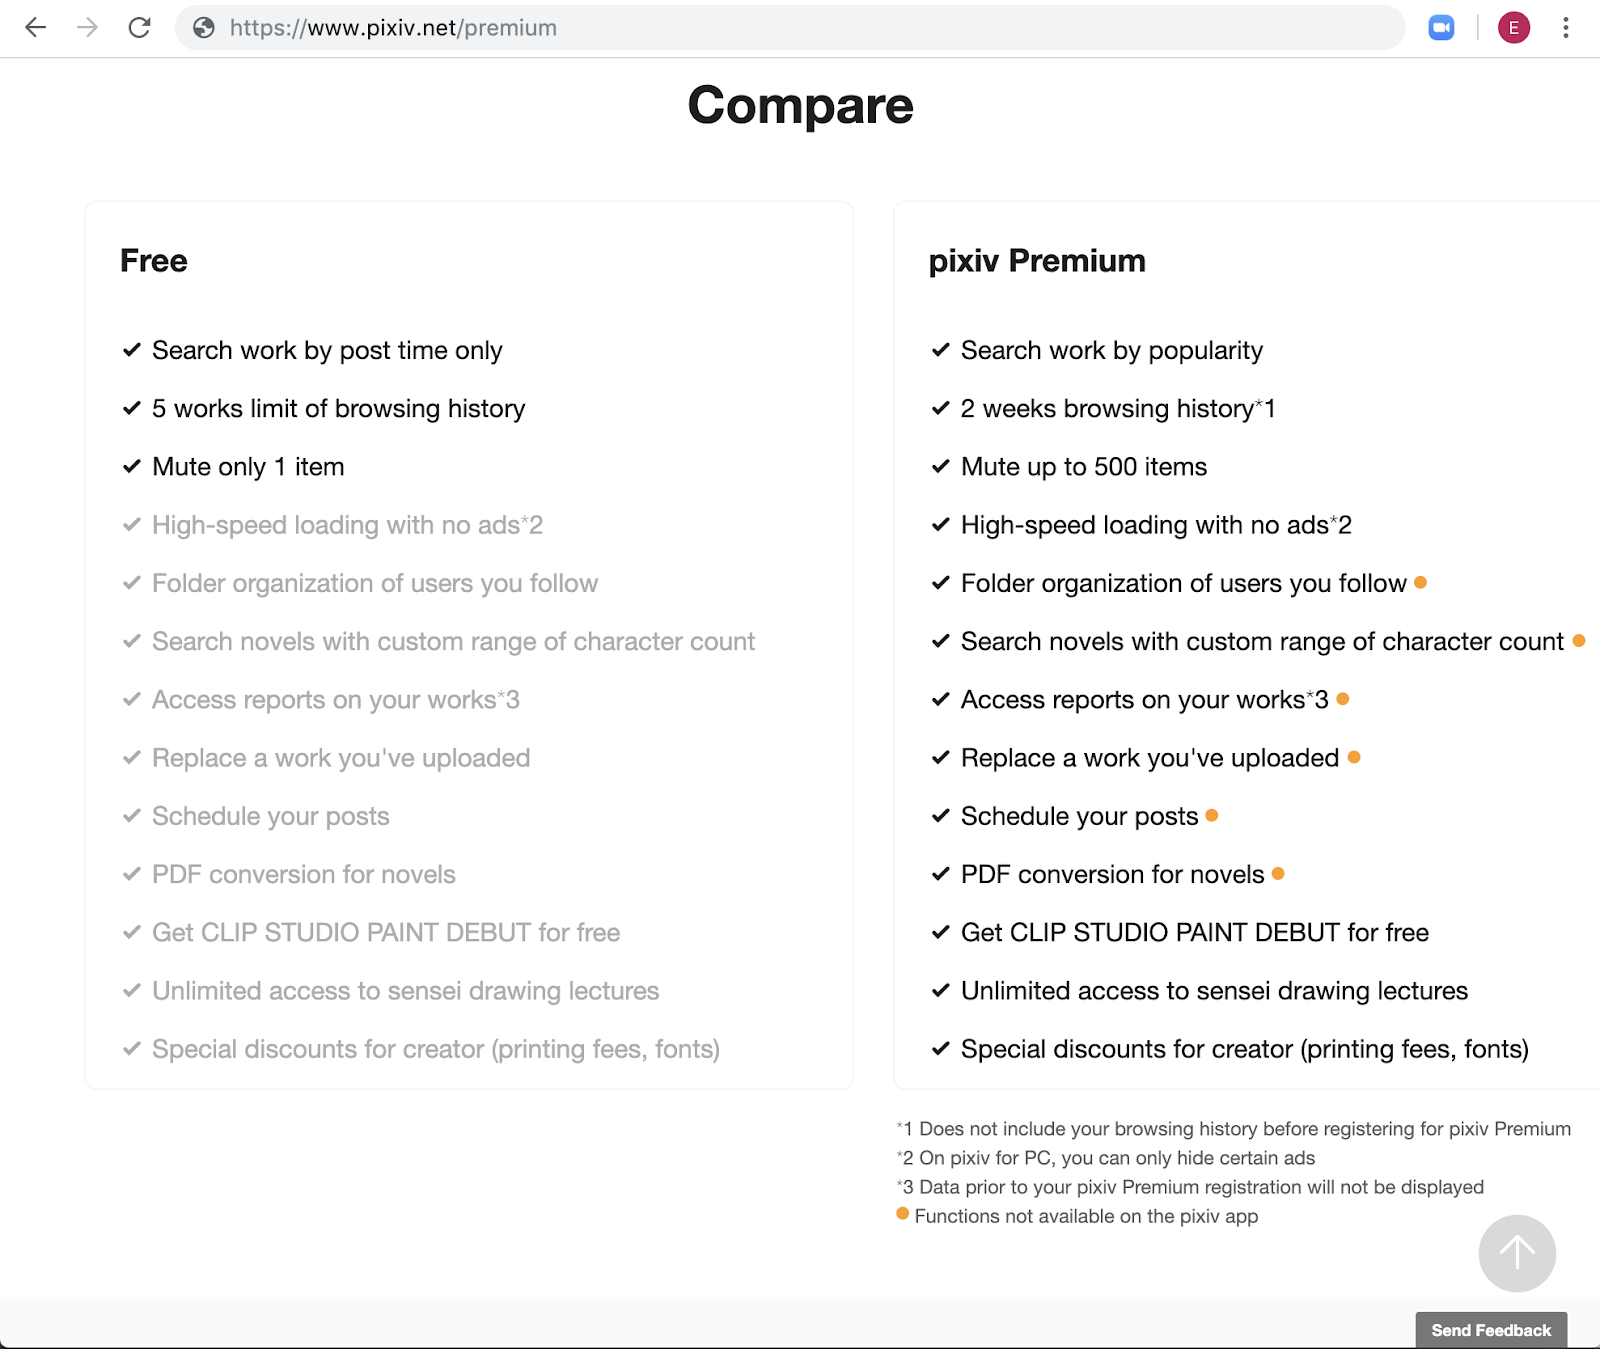
Pixiv is a fan art platform that helps artists showcase and distribute their art. Pixiv has an analytics portal to help artists analyse the demographics of their fans. Artists can now explore and drill into who saw/liked/commented/bookmarked/followed their art. They have put analytics in a premium tier of their offering in order to encourage free users to upgrade and become paid “premium” users.
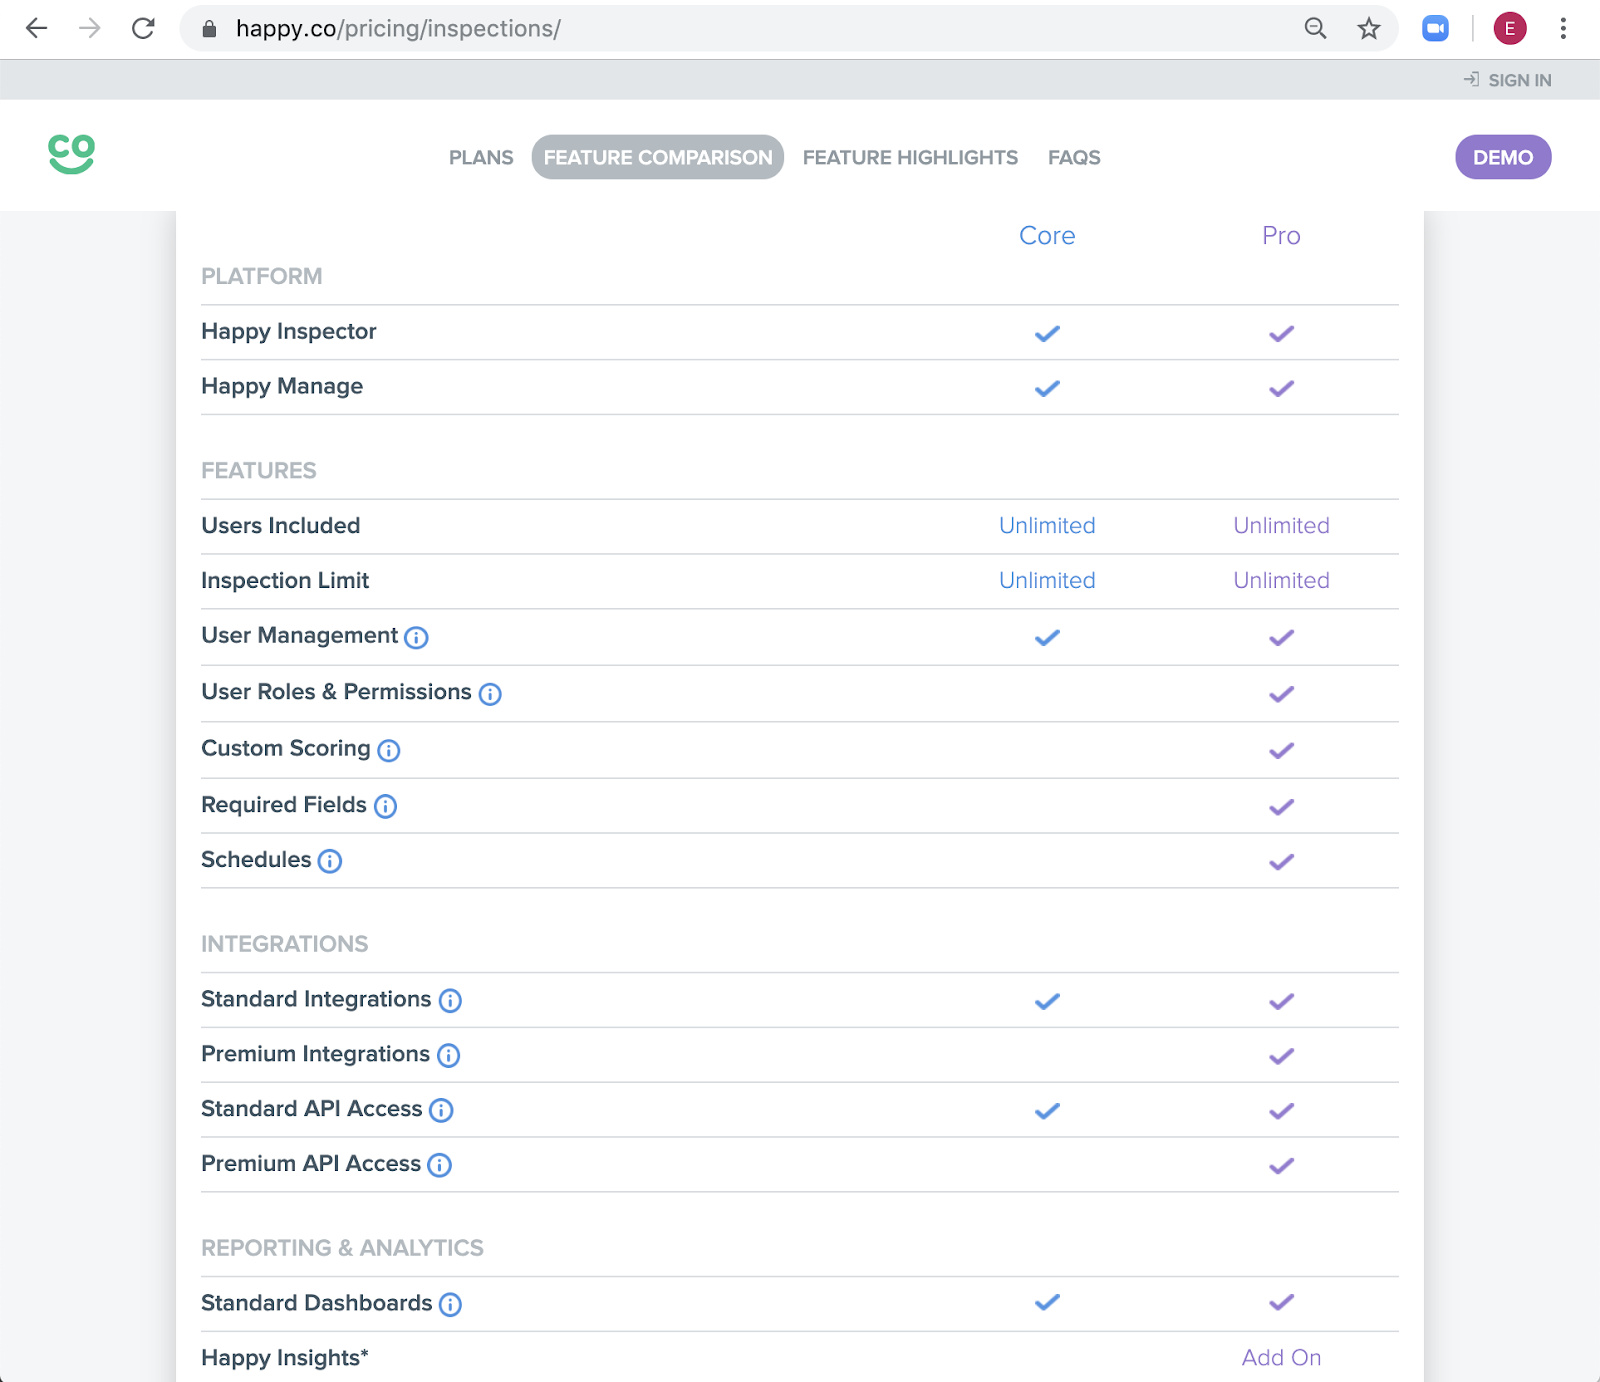
Happy.co, B2B Operations
price analytics in premium tiers to drive upgrades
Below the 5 most important ways to distribute content in front ends. Details on how to develop Embedded BI are explained in our series “What is Embedded BI and how it can be achieved”
- Web embedding
- Secure custom portal
- SAAS / COTS embedding
- Concise, real-time, and interactive embedding (embedded at decision points)
- Embedded analytics apps and action-oriented dashboards
Best practices for data products
Rapid iteration to validate, grow product-market fit and the strategic analysis to identify revenue opportunities are two components that should be covered in the exploration phase before you start developing.
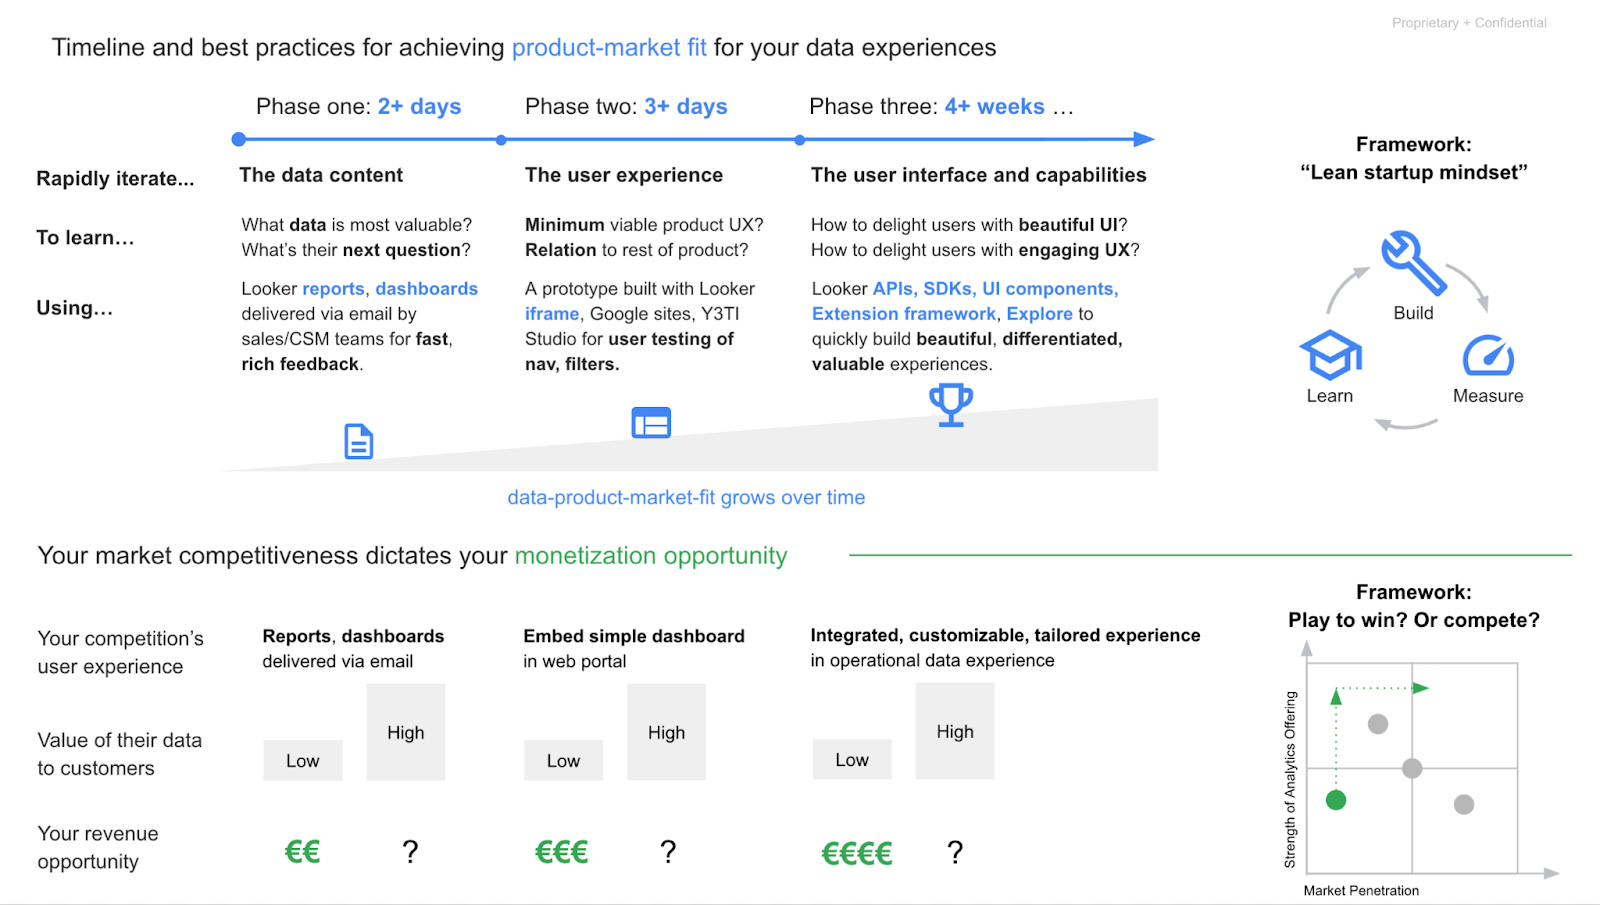
First you start with the product-market fit and within this part you start with the data content. What is the most valuable data? In this example, Looker reports and dashboards delivered by e-mail. The next step is the user experience. In this phase, a minimum viable product can be built for user testing. Data product market fit grows over time. With the user feedback you are now able to design an engaging UX that delivers differentiated and valuable experiences.
As shown above, your monetisation opportunities depend on your competitive advantage in the market, the value of the data, the way you share the data and customisation of the experience.
Below you find an overview of the value of insights by type of feature.
Next steps
Partner with the stakeholders that are needed to make it happen. Include several roles such as leadership sponsor, a product lead, finance, marketing, IT and not to forget clients for feedback and testing. This is a cross-functional project. Involve your stakeholders early.
Partner with an ecosystem of experts including Crystalloids and technology vendors for tasks such as business case, solution architecture, platform development, engineering, data management, monitoring of the solution on data and cost.
And as always, start small, fail fast, get traction: reports → products → monetise
Conclusion
If you see opportunities to generate revenue and a competitive advantage from offering added-value dashboarding you now have an overview of what can be done to achieve this goal. Crystalloids can help you with the technical steps in your journey from design to development and the maintenance of the solution.

ABOUT CRYSTALLOIDS
Crystalloids helps companies improve their customer experiences and build marketing technology. Founded in 2006 in the Netherlands, Crystalloids builds crystal-clear solutions that turn customer data into information and knowledge into wisdom. As a leading Google Cloud Partner, Crystalloids combines experience in software development, data science, and marketing, making them one of a kind IT company. Using the Agile approach Crystalloids ensures that use cases show immediate value to their clients and frees their time to focus on decision making and less on programming.


%20(1).png?width=75&height=75&name=Contact%20Services%20(800%20x%20800%20px)%20(1).png)
