Share this
![]() Palina Salimyanova
on Feb 19, 2024 12:56
| Updated: May 15, 2026 11:39
Palina Salimyanova
on Feb 19, 2024 12:56
| Updated: May 15, 2026 11:39

Business Intelligence tools are crucial in transforming raw data into actionable insights, enabling data-driven decision-making within organisations. In this blog post, we'll compare three prominent BI tools that allow this: PowerBI, Looker and Tableau. Given our extensive experience with all three platforms, we believe sharing our insights can offer valuable perspectives for your consideration.
Evaluating these tools based on their effectiveness for your business, data analytics capabilities, and handling various data sources is essential in making an informed decision for your organisation's analytics.
Overview: Looker, Tableau, & PowerBI
LOOKER
Imagine a platform empowering business users to explore and analyse data independently, with no technical expertise required. Looker achieves this through its semantic layer, which acts as a translator between your raw data and your business needs. It simplifies complex data models, defines business terms, and enables users to explore and analyse data without needing deep technical knowledge.
- Strengths: Robust modelling language (LookML), centralised data model, fast insights, powerful data dictionary, self-service analytics capabilities, a wide variety of options for sharing actions, well-integrated in the Google Cloud console and seamless Google Workspace integration.
- Weaknesses: Higher starting price point, less stunning visualisations
- Best for: Organisations prioritising data security, central control, and user empowerment across various skill levels.
TABLEAU
Tableau is a renowned visualisation tool that stands out for its user-friendly approach and impressive visuals. Those who use Tableau appreciate the ease of data exploration and the creation of visually stunning dashboards and reports through its intuitive drag-and-drop interface. However, Tableau's governance options are limited, and its speed and performance can struggle with massive datasets.
- Strengths: Drag-and-drop interface, ease of use, stunning visuals, broad data source connectors.
- Weaknesses: Limited governance options for large-scale data security. Performance struggles with massive datasets. Not ideal for highly customised data modelling.
- Best for: Individuals and teams prioritising quick data discovery, interactive dashboards, and visually impactful communication.
POWERBI
For organisations deeply embedded in the Microsoft ecosystem, Power BI offers a compelling choice. Its seamless integration with Microsoft tools creates a cohesive workflow. Additionally, Power BI boasts a mobile experience that allows users to access and interact with data on the go.
- Strengths: Seamless Microsoft integration, built-in AI features, mobile experience.
- Weaknesses: Less intuitive interface compared to Tableau, limited data source options. A low entry license layer but be aware in a later stage PowerBI can become expensive using enterprise editions.
- Best for: Microsoft-centric organisations, mobile accessibility, and a familiar workflow.
Data Visualisation and User Experience:
While less visually striking than Tableau, Looker uses its powerful semantic layer features to compensate for its visuals, prioritising data transformation and business logic in its central layer to enhance the overall user experience. Moreover, Looker's data visualisation options are soon to be enhanced by Google to bridge the gap with Tableau regarding interface aesthetics.
Tableau offers a visually appealing and user-friendly interface, praised for its extensive library of visualisation options and customisation features. The platform stands out for creating impactful dashboards and providing diverse visualisation types, catering to various reporting needs.
PowerBI offers seamless integration with other Microsoft tools. While it may not match Tableau's visualisation variety, Power BI provides a clean and straightforward interface. The platform is known for its ease of use, allowing users to grasp its functionalities and build insightful reports quickly.
Feature Deep Dive:
While Tableau and PowerBI shine with data visualisations, features of Looker go beyond traditional analytics tools, empowering business users with intuitive features and artificial intelligence to unlock valuable insights; here are a few to highlight:
Dimension Mapping: Imagine analysing data by dimensions or fields that don't exist in your sources. It could be anything, for example, "content author" or "partner tier". Looker's semantic layer shines here, allowing you to create custom dimensions tailored to your needs. Tableau and PowerBI require workarounds like calculated fields or external tools, introducing complexity and potential performance downsides.
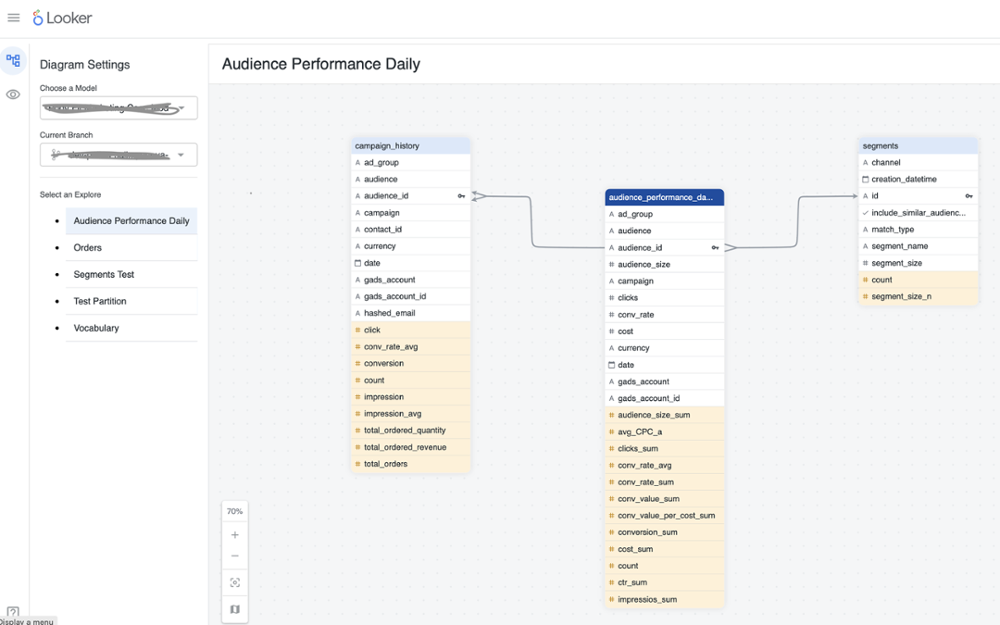
LookML Diagram: This unique Looker feature visually depicts relationships between data objects, empowering everyone to understand and explore data intuitively. Tableau and PowerBI would require error-prone calculations, external tools, or manual documentation to enable this.
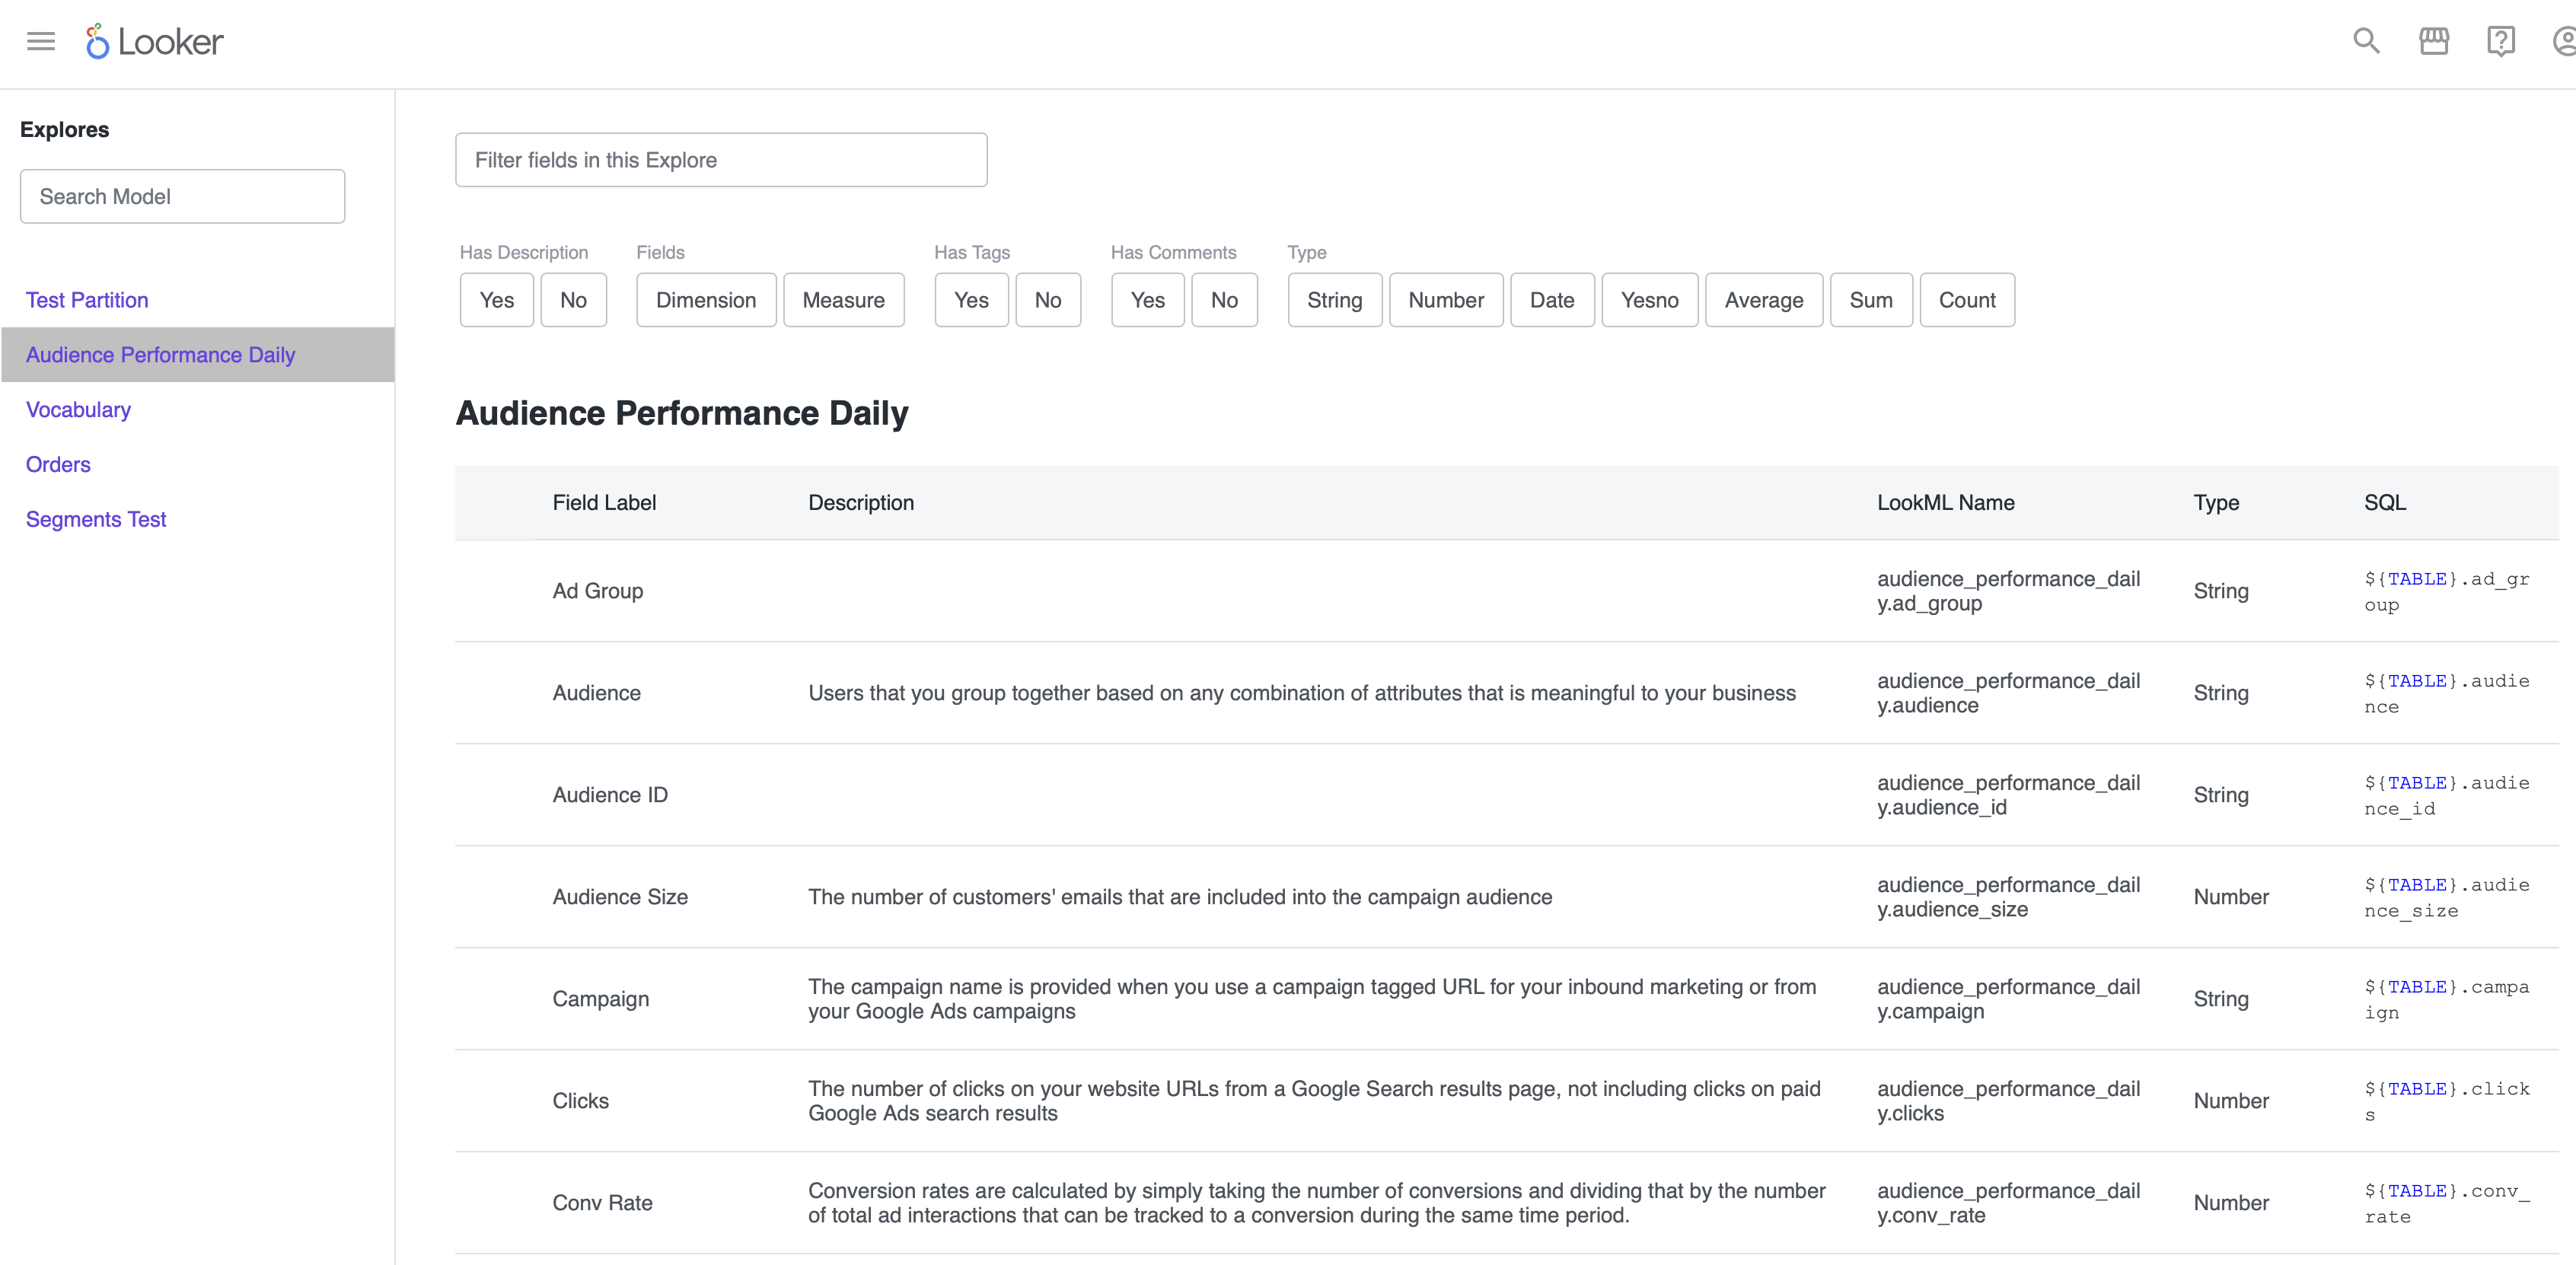
Business Vocabulary: ensure everyone speaks the same data language! Looker is a centralised hub for defining and documenting business terms in its data dictionary. This eliminates confusion and inconsistencies across departments, something Tableau and Power BI lack, requiring manual consistency checks across disparate locations.
Calculated Metrics: Need metrics like "revenue per employee" or "employee distribution by title"? Looker offers a user-friendly interface for building them without coding. Tableau and Power BI require formulas, which, especially for complex calculations involving multiple fields, aggregations, or conditional logic, can significantly increase processing time, especially with large datasets.
Join Views with Ease: Segmenting data by department or specific criteria should be smooth. Looker empowers you to build pre-built data models tailored to your needs. Business users can then leverage these models for analysis without technical expertise. Looker Blocks can also simplify complex joins by providing pre-built models with optimised joins for specific data sources. In Tableau and Power BI, complex joins might require SQL knowledge or manual editing, impacting accessibility and performance.
Democratize Data Exploration: Looker's intuitive interface and automatic SQL query generation eliminate the need for developers. Tableau provides a drag-and-drop interface, but advanced features require technical knowledge. Power BI's interface can be less intuitive, and complex analyses often involve formulas.
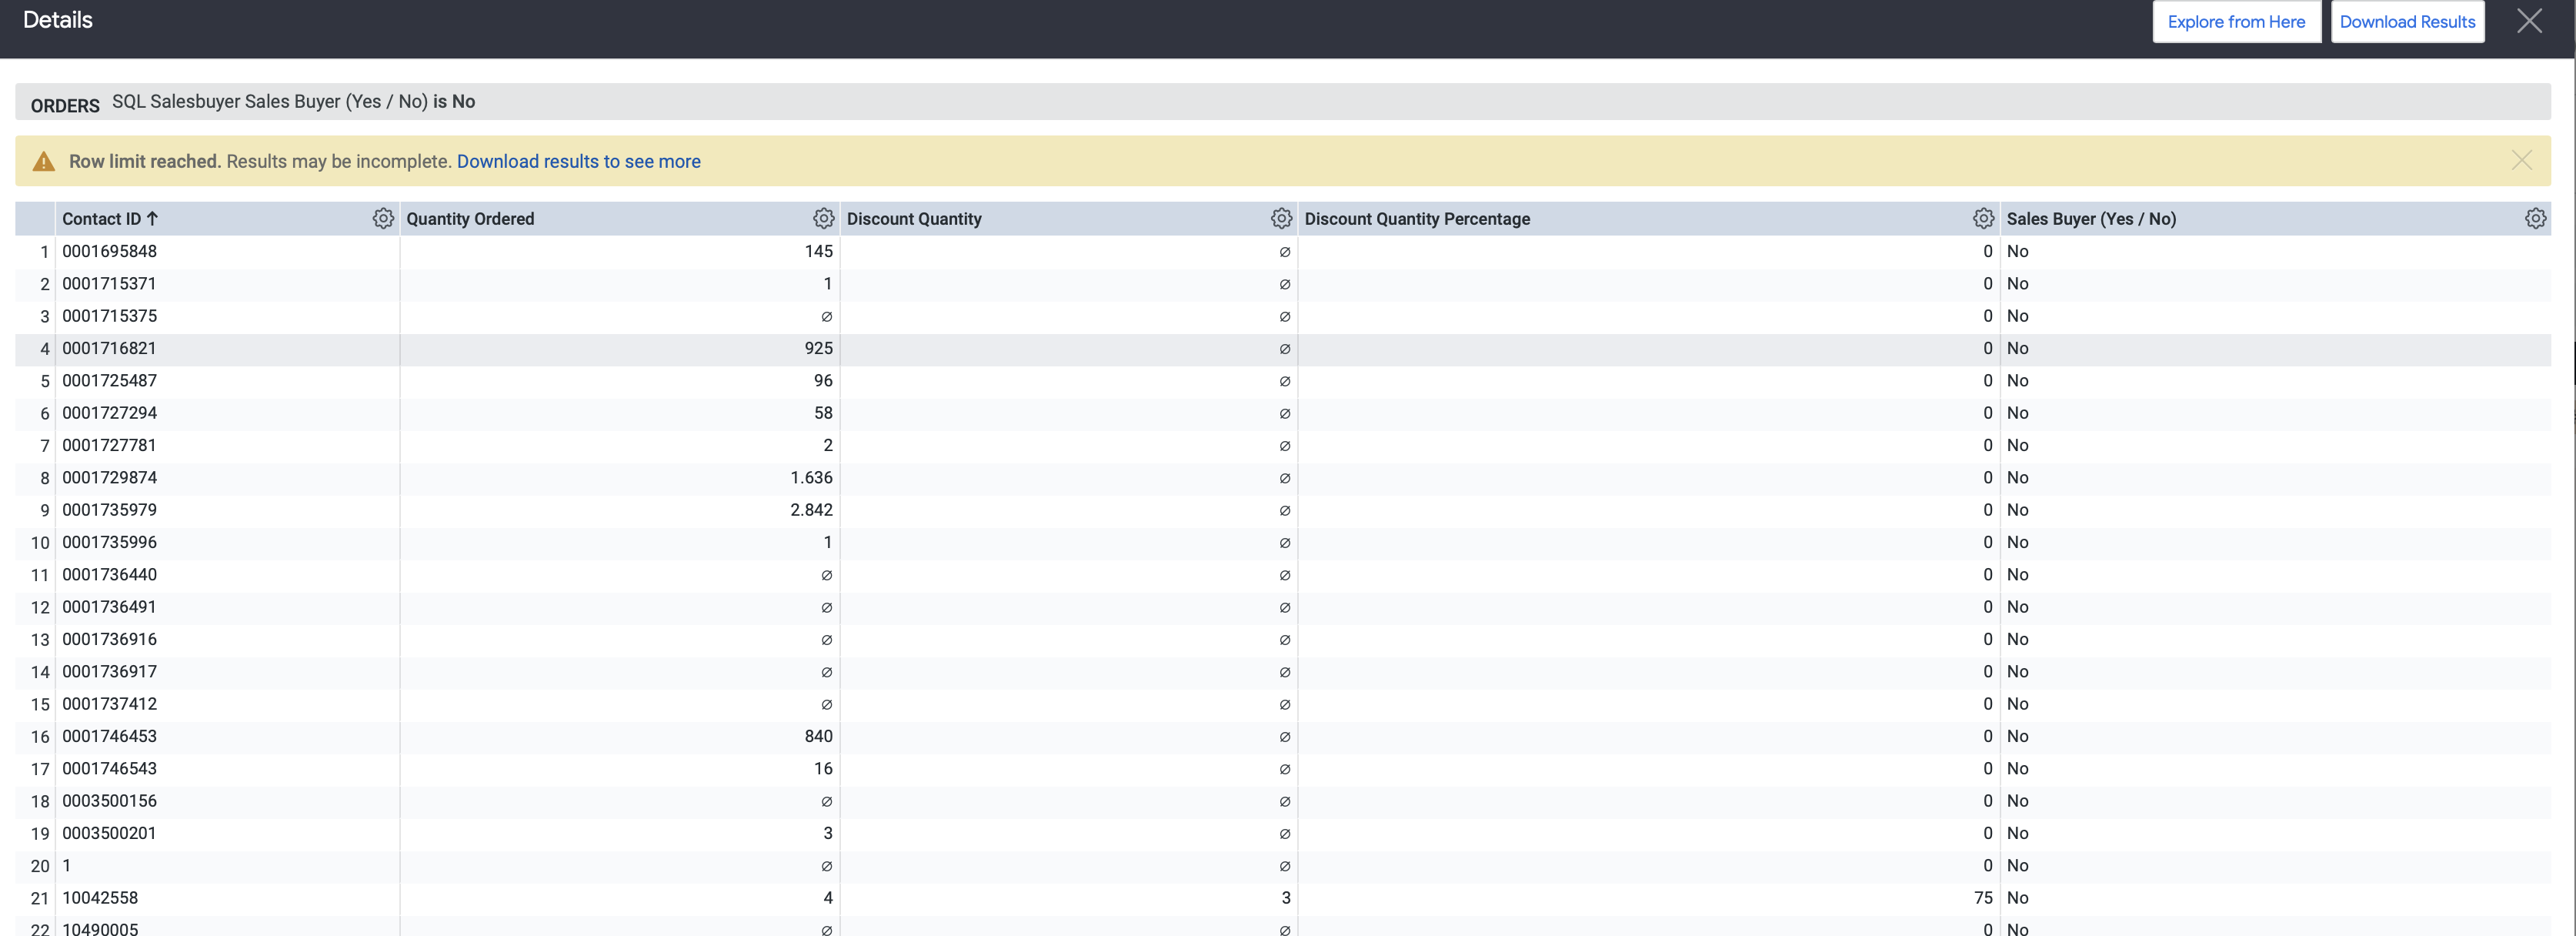
Drill Down for Deeper Insights: Uncover hidden trends and patterns by zooming into specific data points. Looker's powerful drill-down functionality delivers this seamlessly without performance degradation. Tableau and Power BI's drill-down capabilities can be impacted by large datasets or complex analyses, potentially requiring additional tools or impacting performance.
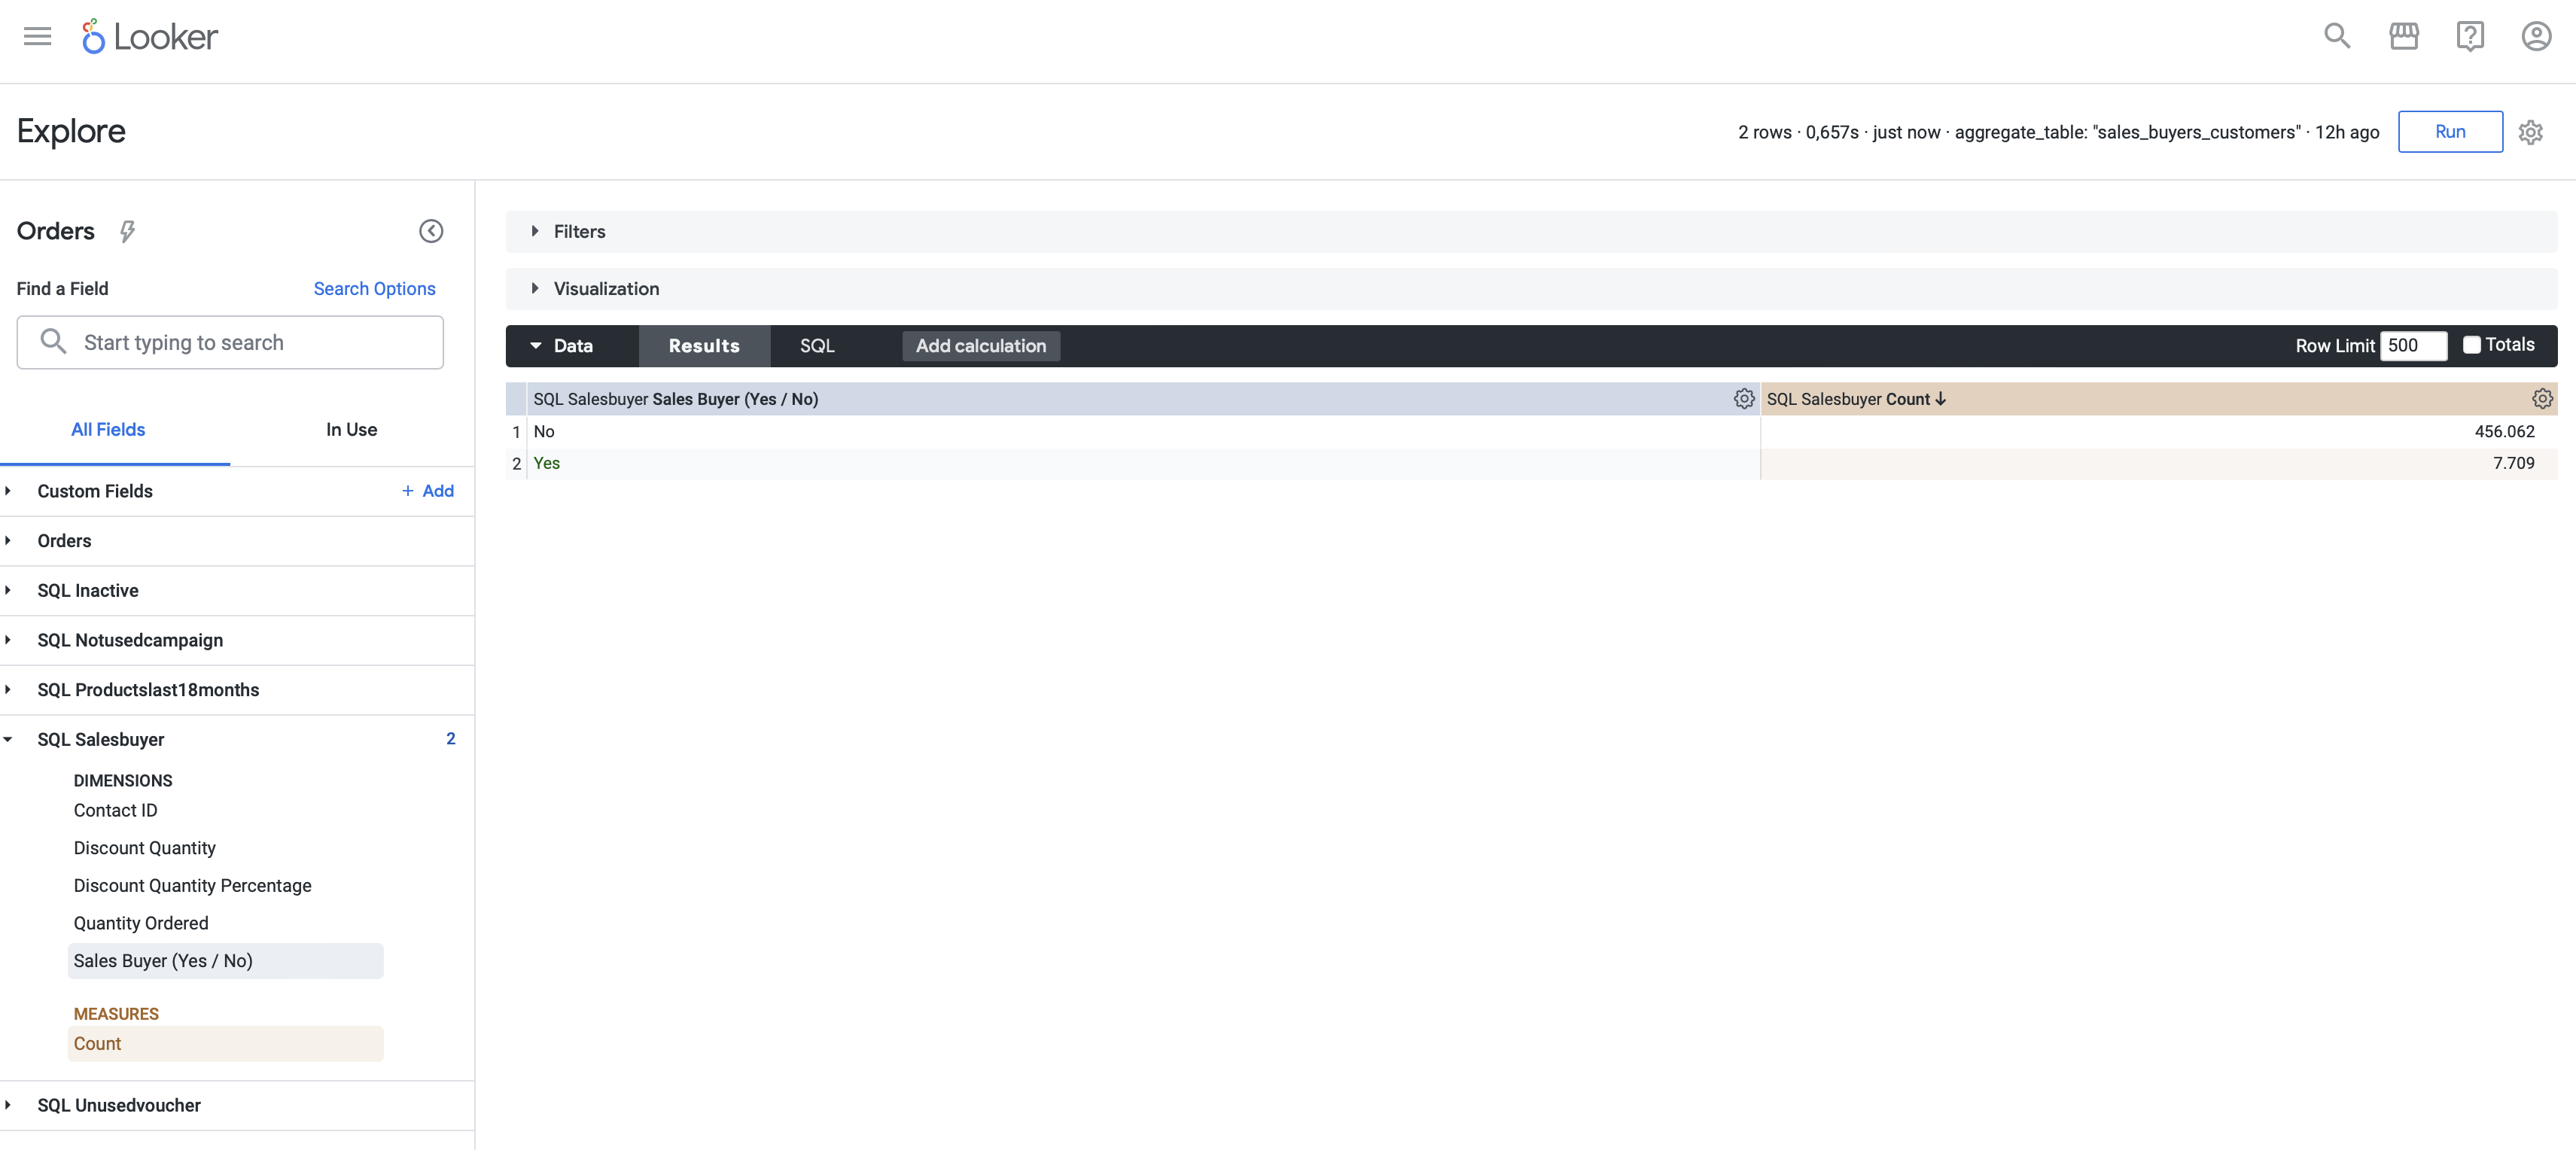
Clicking on the count allows the user to view the specific individuals included in this count.
Flexibility and Scalability:
Looker
Looker's strength lies in its semantic layer, providing a centralised space for data transformations and business logic. This unique feature streamlines data-driven decision-making by allowing users to explore data and generate insights without requiring extensive technical knowledge. The BI platform excels in scalability, allowing organisations to add users seamlessly without worrying about increased costs.
Tableau
While offering robust visualisation capabilities, Tableau lacks a per-user licensing model. This could increase costs when expanding user access, especially for organizations that prefer a gradual scaling approach.
PowerBI
With the availability of inbuilt licenses and the flexibility to start with a free version, organisations can experiment with Power BI without high upfront costs. The per-user licensing model further facilitates easy scaling, allowing businesses to start with a few licenses during development and expand gradually.
Pricing and Accessibility:
Cost is crucial in choosing a BI tool, and each platform presents a different pricing structure.
Power BI, a Microsoft product, is advantageous for organisations with Microsoft licenses, offering seamless integration. Its diverse licensing options make it a cost-effective entry point for smaller businesses. The per-user licensing model allows organisations to control costs based on their specific needs.
Tableau pricing works with license types for diverse user roles, including advanced creators, intermediate explorers, and casual viewers. Consider various factors, such as deployment type and support, to understand the total ownership cost comprehensively.
Looker requires an upfront investment in the entire platform, providing unlimited user access for scalable solutions without increased costs based on user numbers. Looker empowers deeper exploration and complex analysis, ideal for organisations with more demanding data needs and a larger budget. What's more, Looker has a model layer that can be connected to Power BI, Tableau and users can take advantage of Looker's semantic layer and the benefits of BI interfaces.
For free, user-friendly data visualisation for quick communication, Looker Studio might be a great option.
Looker Proof-of-Concept
When considering Looker pricing, your business can explore proof-of-concept initiative supported by Google, allowing a strategic evaluation compared to Tableau or PowerBI.
Instead of upfront license commitments, organizations can collaborate with Crystalloids to discuss their specific use case.
During a concise 3-week proof-of-concept phase, Crystalloids develops a Looker visualization, enabling your business to decide whether Looker is the right fit for your needs when you choose to use Looker.
Conclusion
Looker is a popular choice for organisations prioritising advanced data exploration capabilities, centralised governance, and empowering business users, making it the best choice for your business, even with a higher investment.
In comparison, Tableau and Power BI are robust data visualisation tools but demand more technical expertise for advanced functionalities and may face performance limitations with complex data analysis scenarios.
The best choice among Looker, Tableau, and PowerBI depends on your specific needs, data environment, and budget considerations in the realm of business intelligence and data.


%20(1).png?width=75&height=75&name=Contact%20Services%20(800%20x%20800%20px)%20(1).png)
