Share this
![]() Richard Verhoeff
on Jul 13, 2021 15:34
| Updated: Jun 10, 2025 12:04
Richard Verhoeff
on Jul 13, 2021 15:34
| Updated: Jun 10, 2025 12:04
Data needs to be collected and wrangled to enable Crystalloids’ management to make well-informed decisions. Graphical data preparation without coding accelerates this process and improves data quality, resulting in more meaningful analysis and significant time savings. Google Cloud Dataprep streamlines data wrangling by delivering exactly the data we need—quickly and easily. Read our story below.
At Crystalloids, we face the same challenges as our clients when it comes to embracing a data-driven approach to decision-making. That’s why we understand their pain. Our data comes from various internal systems, and when combined, it becomes far more valuable. It helps us create forecasts, set budgets, and make strategic predictions. But combining data can be complex, time-consuming, and at times, frustrating. In this article, we’ll show you how to combine only the data you need and prepare it for analysis—efficiently and without coding.
How we used to handle data-driven decision-making
To get a complete view of our business, we used to download reports from multiple systems and manually merge them in spreadsheets. While this worked, it was tedious and inefficient. As our company expanded, we reached the limits of what our project administration, invoicing, and bookkeeping tools could support. Reporting, in particular, lacked the flexibility we needed.
Difficulties in setting the right KPIs
We rely on KPIs to manage our business, but it became increasingly difficult to attribute revenue to them accurately or implement them properly in Exact Online. To create a meaningful KPI, we often had to introduce new classifications and manually copy-paste data to achieve the desired output.
This process wasn’t ideal.
We explored alternatives: should we use macros or App Script in Google Sheets? Or maybe combine Sheets with Python? But that would require programming skills—and time is always limited. So we asked ourselves: “Can we do this faster, preferably without writing code?”
A more detailed view of the problem
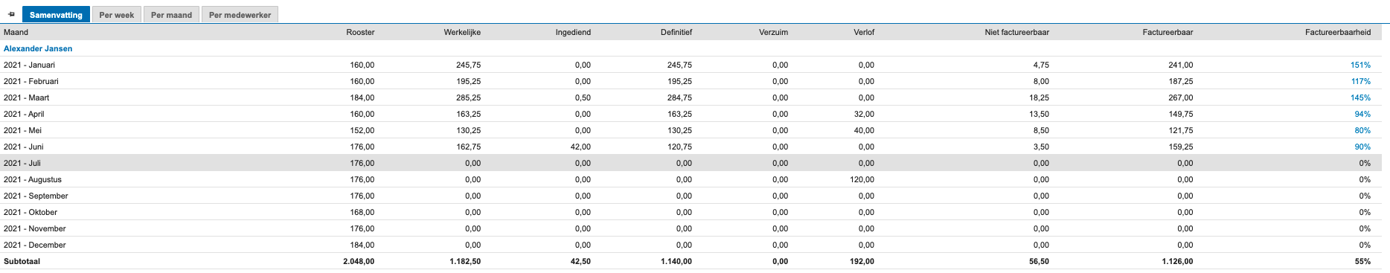
Here’s an example. As a consultancy, it’s crucial to monitor the occupancy of our team members across projects.
In Exact Online, one employee showed an occupancy rate of over 100%—caused by an “out of office” task, which shouldn’t be included in project occupancy calculations. Unfortunately, Exact offered no way to log or exclude these hours in its reports.
So, we exported the data to Google Sheets and manually adjusted it—deleting, merging, classifying, aggregating, and pivoting as needed. For every quarterly meeting, we created a new report. Producing monthly or weekly reports simply required too much effort. We wondered: could we get the data exactly how we need it, on-demand, without all the manual work?
That’s where data wrangling comes in.
Data wrangling, what’s that?
If your data is incomplete or inconsistent, your analysis—and your decisions—will be too. Data wrangling ensures your data is accurate, clean, and analysis-ready. It involves transforming raw data into a usable format, tailored to your specific use case. One of the best tools for this is Google Cloud Dataprep.
Google Cloud Dataprep
Google Cloud Dataprep is one of Google’s data services for cleaning and preparing structured and unstructured data for reporting, machine learning, and analysis. Dataprep interprets the data transformation through a proprietary inference algorithm.
A ranked set of suggestions and patterns will be returned and displayed in a graphical user interface. With a click on the mouse we can apply aggregation, joins, unions, pivot and unpivot, regular expressions, extraction, merge, and much more to the data.
Let’s see how we can use Google Cloud Dataprep is a solution.
To create this overview, three extracts from the Exact Online system are needed.
- The list of all current active employees.
- Overview of worked hours per project.
- Overview of all available hours per month and absence hours per month.
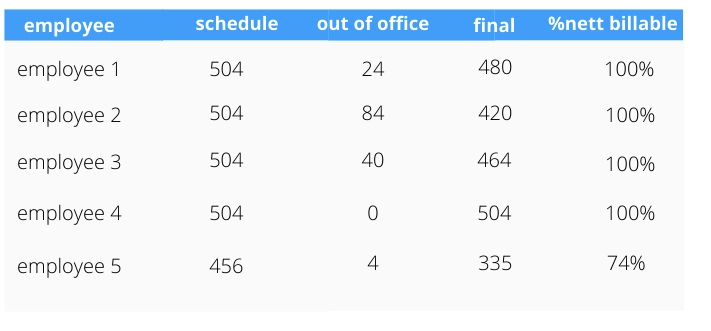
To calculate the % Nett Billable, we will need the following formula:
Accountability = IF(Schedule<Final;Final/Schedule;1-(Out of office)/Schedule)
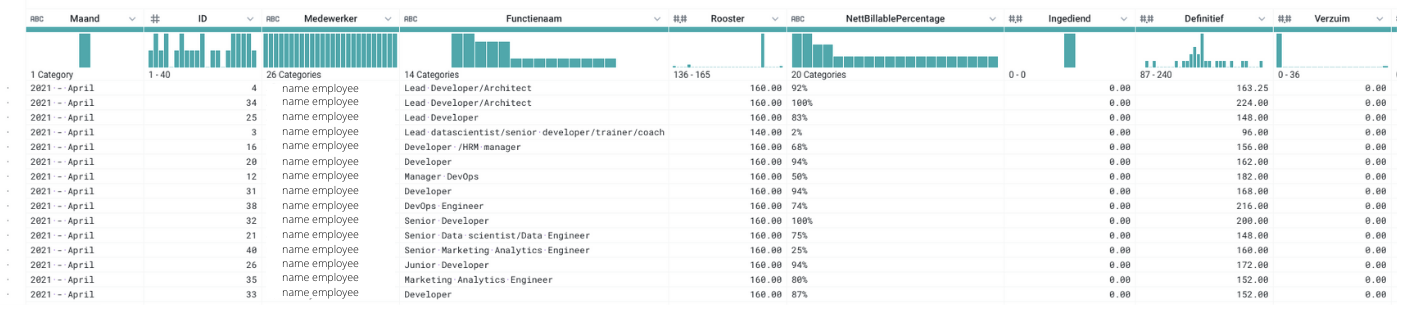
In the image above you see the Dataprep UI. With only two lines of codes that are generated by the graphical user interface, the first steps to more meaningful data are made. We can easily expand the same file with more data or repeat the same query. A perfect example of the beauty of automation. We can get to exactly that data we needed in just a few clicks, without any coding!
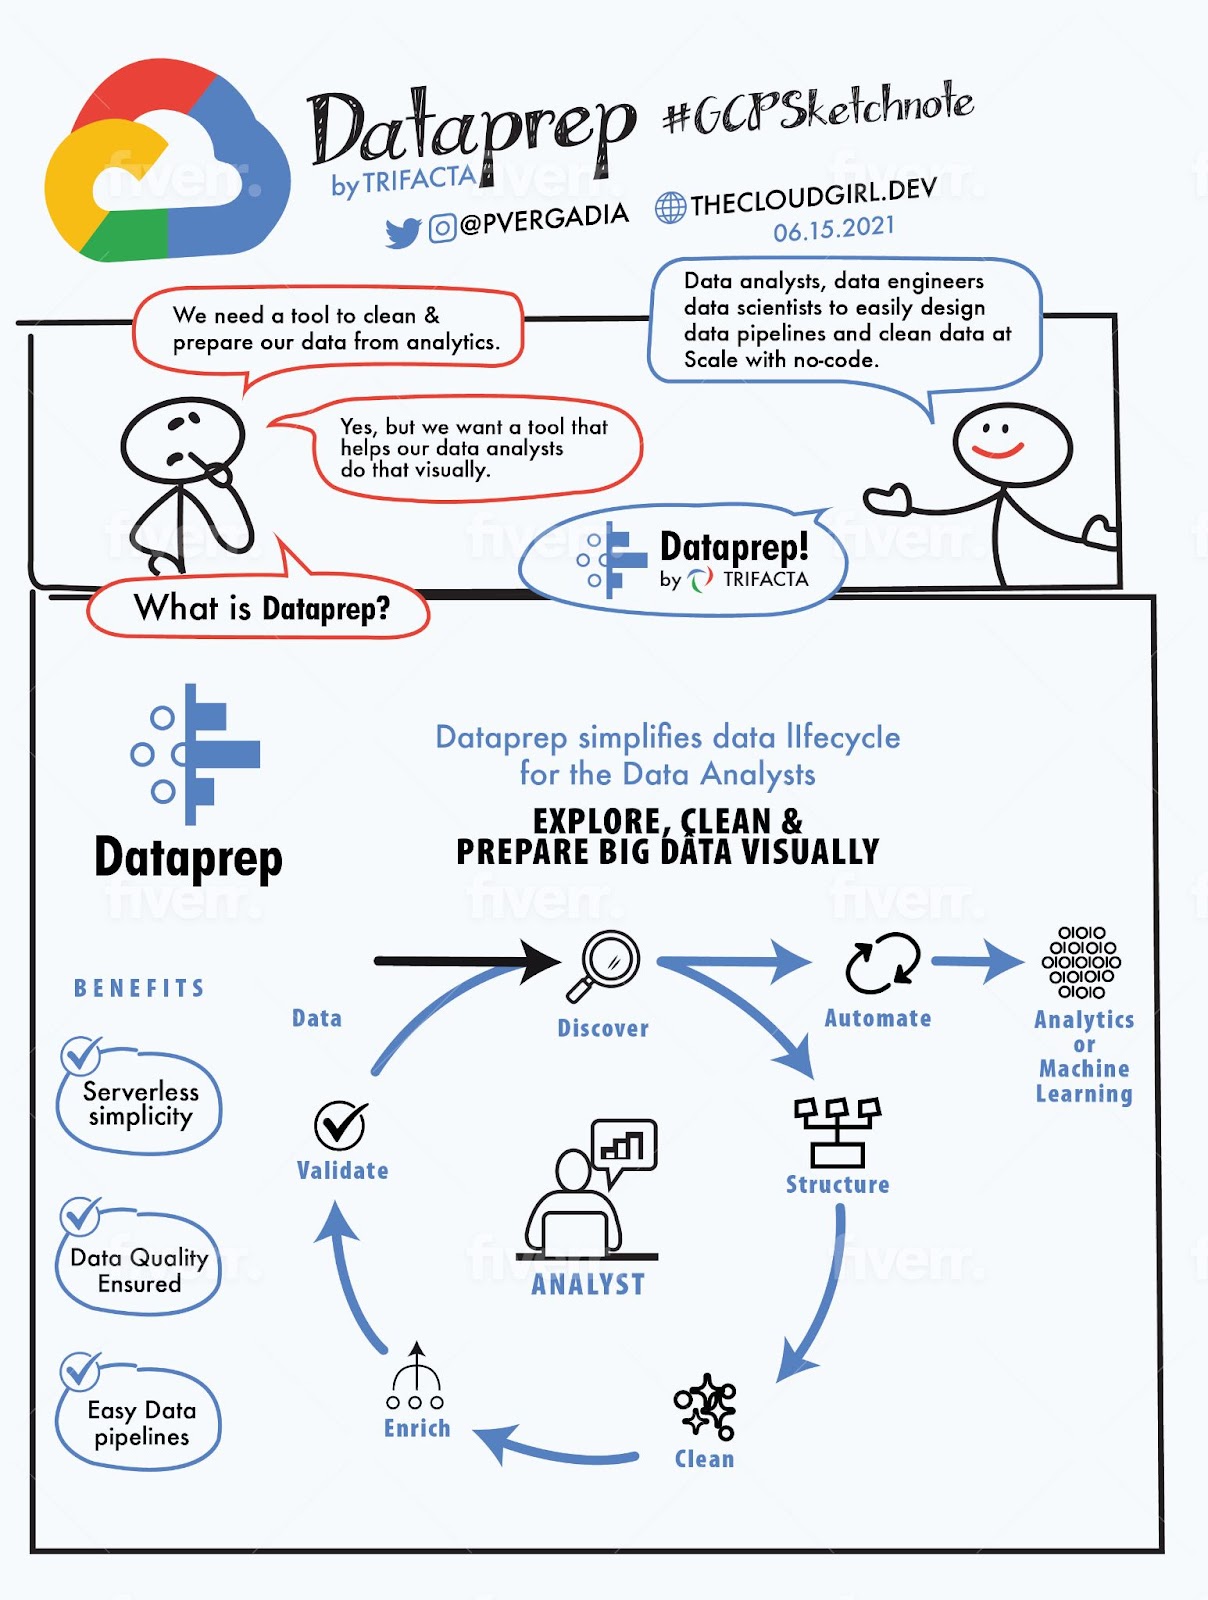
The image below shows how Dataprep simplifies the data lifecycle and smoothens the way to more meaningful data.
Conclusion
Combining data from multiple systems into one meaningful dataset can be a time-consuming process. It often involves programming or extensive manual work—distracting us from what really matters: making smart, data-informed business decisions. Visual data preparation tools like Google Cloud Dataprep speed up the process and enhance data quality, which leads to deeper insights.
Dataprep made our data preparation faster, easier, and more scalable. With just a few clicks, we get the data we need—when we need it. Are you facing similar challenges? At Crystalloids, we have extensive experience with Google Cloud Dataprep. Book an online appointment to learn how we can help.


%20(1).png?width=75&height=75&name=Contact%20Services%20(800%20x%20800%20px)%20(1).png)
