Share this
![]() Marc de Haas
on Jul 13, 2021 15:35
| Updated: Jan 22, 2026 16:29
Marc de Haas
on Jul 13, 2021 15:35
| Updated: Jan 22, 2026 16:29
In my first blog in the series, I described the types of embedded BI as a user interface and what it can bring to your company, clients, partners, and employees.
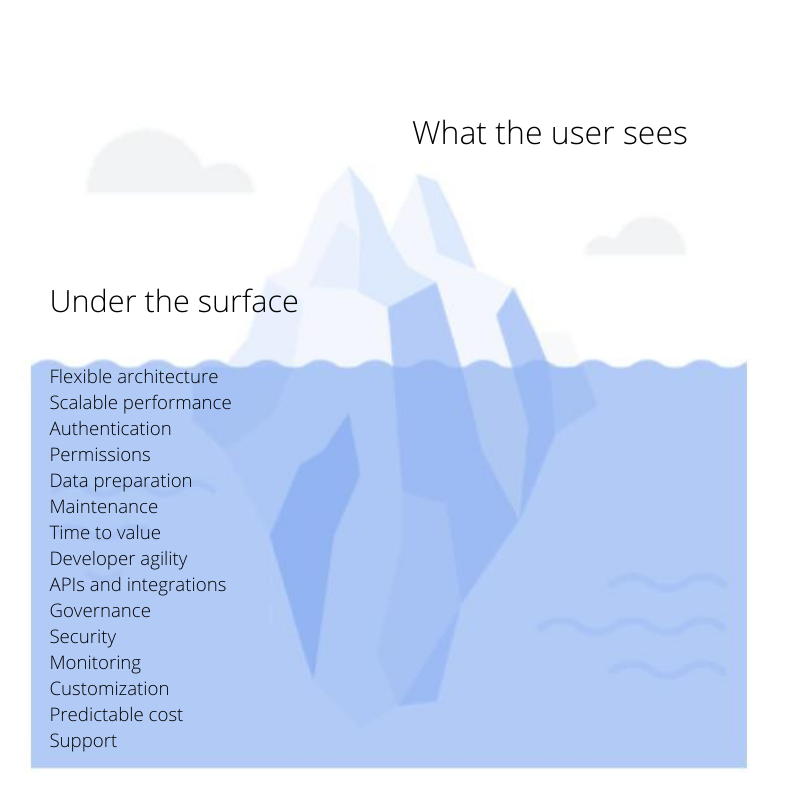
Not surprisingly, for us as data and technology specialists, the data consumption will only see the functionality. Beneath the surface, many elements need to be covered. Creating the user interface is the easy part, managing the data governance, access and security can be tough. Setting this up in a way it can be easily maintained, adapted, and scaled is beyond the capabilities of most technologies.
In order to be able to serve embedded BI, the following elements have to be in place:
- Database and infrastructure
- Analytics platform
- The development team
Blog 1: What is embedded BI and what it may bring
Blog 2: A modern platform and a SCRUM Agile team to deliver Embedded
1. Datastore
An analytical datastore also called a database, stores and manages the data that is necessary for Embedded BI. Analytical datastores are scalable and optimized to execute queries faster. An analytical datastore such as Google Big Query should provide:
- Scalability
- High concurrency
- Separation of storage and processing
- Streaming data ingestion
- Structured and semi-structured data
- Data Governance
- Access Management & Security
- Reliability
- Simplicity, ease of use
- Cost efficiency
The platform is more than a database, logic components of the platform
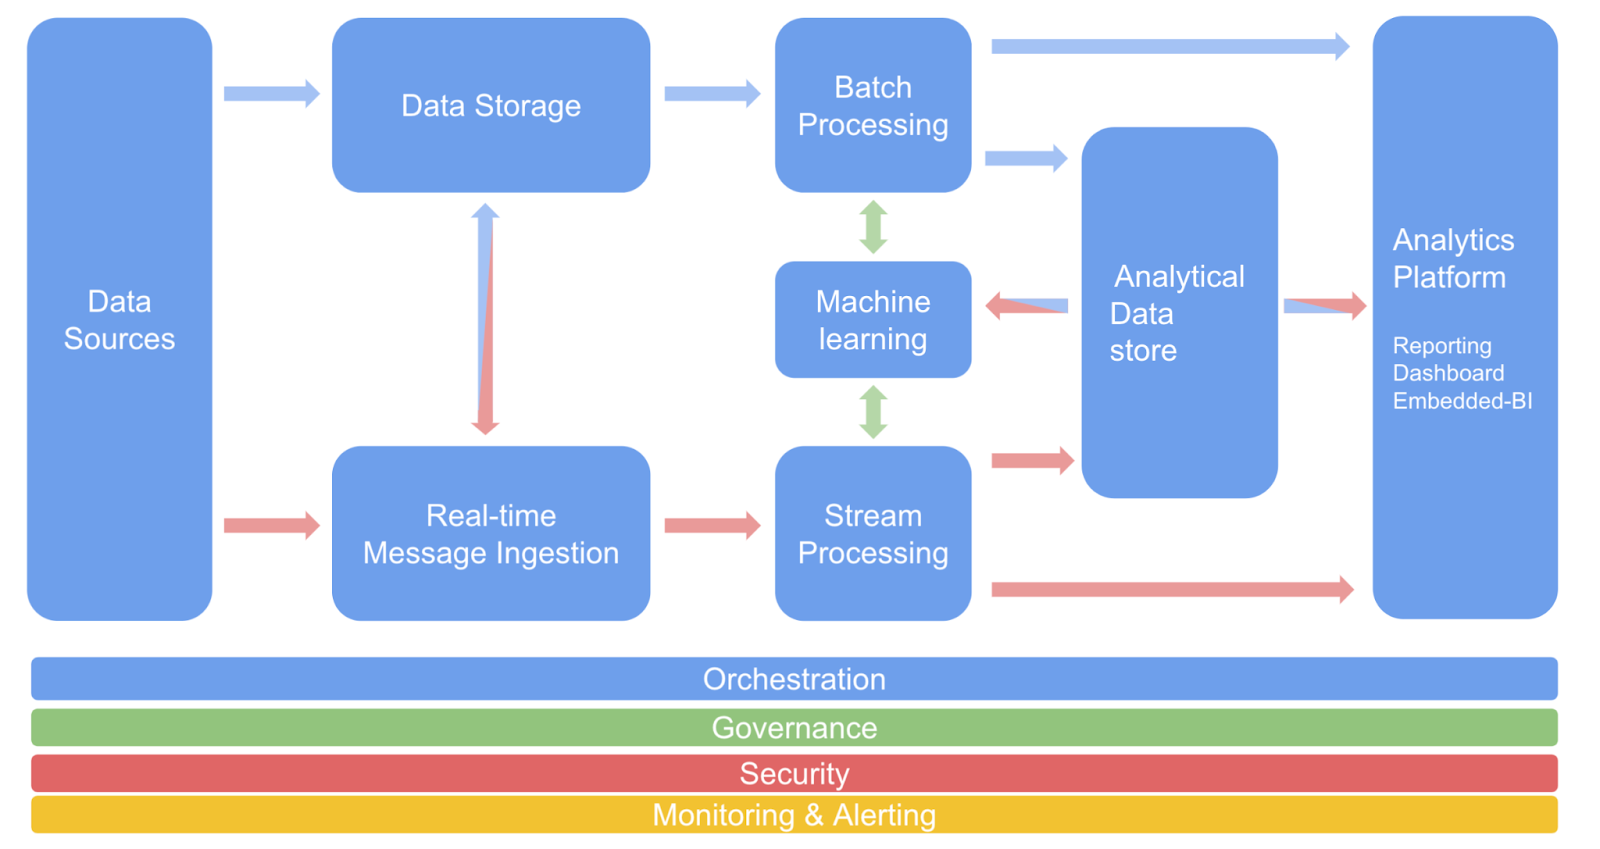
In the platform, part of the data comes in real-time and part in bulk in most cases. The batch enters the system as bulk and is stored in data storage before it gets processed. Real-time also called streaming data, is processed as messages and can be processed directly. Real-time data is also stored in Data Storage (so it becomes bulk) if there is a need to reprocess the data later for other use cases.
Machine learning is shown in the image because it is not only about training the models, but also a model repository to apply the models during processing. Also, you need a performant analytical datastore such as Google Big Query. I will dive into that later in this article. In this image, the red lines are the hot streaming lines and the blue lines are the cold, bulk lines.
The bulk and streaming processes have to be orchestrated because of the dependencies between jobs. Most clouds offer tools to monitor the data, such as automated detecting of PII (Personally Identifiable Information). We handle PII data always separately and are only accessible to data consumers that have the right privileges to adopt the principle of least privilege principle.
Security and monitoring can be provided by public clouds that offer very nice features for this. If you have a multi- or hybrid cloud, there are solutions that can handle multiple platforms nicely.
Monitoring and alerting on the performance of the platform including data and cloud consumption are required. This can be executed by Crystalloids.
2. Analytics Platform
What to expect from an analytics platform
- Agility
- Flexibility
- Semantic model
- Visualizations
- In-memory analytics / caching
- High concurrency
- No-code / low-code options
- API’s
The points below should be taken into consideration when you choose an analytics platform:
- Adoption of composable analytics to provide consumer-focused analytics applications
- Support for embedded BI use-cases
- Build versus buy
OEM, Embed/Iframe, and API’s
- OEM = BI tool with customized look and feel
- Embed / Iframe / Embed SDK
- API’s
An API-first development philosophy has advantages. APIs from multiple analytics vendors, integrated into a data platform, enable organizations to create composable analytics.
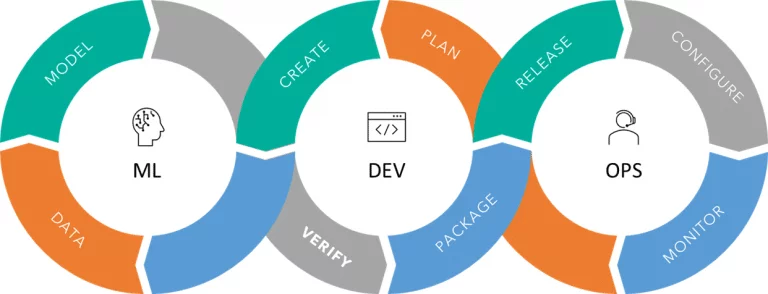
ML as part of the analytical platform to infuse ML into embedded workflows
Machine learning technologies give us access to predictive insights, helping us to better consider the future as we weigh options. If you have more than 3 models in production, you might need to operationalize ML using the ML Ops processes because of the manual labor involved if you don’t adopt ML Ops.
The ML platform should support developers, data scientists, analysts with SQL knowledge, citizen data scientists who use a graphical interface.
3. The development team
At Crystalloids, we deliver in sprints and maintain a constant dialogue between our developers and the clients of our product owner and stakeholders. Scrum has three roles: product owner, SCRUM master, and the development team members.
The product owner has a mandate and is available to fulfill his or her role to safeguard quality, agility, and velocity. Crystalloids usually deliver the development team and the SCRUM master, the product owner is preferably supplied by the client.
The SCRUM master is responsible for gluing everything together and ensuring that scrum is being done well. In practical terms, that means the scrum master helps the product owner define value, the development team delivers the value, and the SCRUM team becomes better. In most cases with smaller projects, the SCRUM master is also developing.
It’s the development team that delivers most of the work. They may be engineers, analysts, or another role that is needed to deliver results.
When a product owner is selected, ensure that they are aligned around and understand the vision for the analytics product offering. This person will become a product and customer evangelist, driving communication about your product, helping determine the features that should be included, and controlling the timeline for launch, so it is highly important that they are equipped with the knowledge and authority necessary to drive the project forward.
The elements for a successful launch
Getting your in- and external customers excited
Getting your customers excited is the first critical step in this phase. Think of this as building an embedded analytics “starter pack.” Build three to five high-value dashboards that are technically straightforward to implement. With these built out, you can choose to embed these as part of your customer portal through SSO (Single Sign-On ) embedding, or can use them to show meaningful data; in view-only mode to a handful of customers. The goal here is to get customer feedback so you know where you should invest time and resources next. The initial investment should be in engaging with your customers after you release these dashboards.
Add functionality and increase the user base
Once you’ve solicited customer feedback from your first few dashboards, continue to build on that starter experience. For example, you can use the information from the beta launch to create additional features or deploy a tiered analytics offering with certain features available for a premium upsell. You can also start to create different levels of user access by adjusting embed user permissions. During this phase, many customers also start to build additional screens to expose user-generated content, offering a more seamless content navigation experience. These features are straightforward to add if the analytical software you are using has out-of-the-box features.
Customize the application experience
By the time you reach this building block, you should have a good understanding of what your customers want. You’re already delivering value to your customers, so you’re ready to begin customizing your offering. If you tried to deliver a customized experience right out of the gate, this would be daunting and a bigger lift. But you’ve already set up the infrastructure — users and APIs, for example — so your developers can now focus on building new features. We recommend you start by adding in commonly requested, high-value custom user interface (UI) features, like more advanced analysis, a custom cohort builder, or a report builder, which is essentially a lighter version of the Looker explore experience.
You can use the API of your data analytics platform as a “backend engine” to power this more customized experience. This enables you to fully integrate your data into your application UI so it looks and feels like your application, rather than the UI of the analytical application.
Conclusion
Embedding analytics is giving a whole new dimension to the company by delivering fresh insights to those data consumers who can benefit from dashboarding to improve their work as they become smarter. It takes time to develop, but the end result is very rewarding. We are there to help you in technical design, development, and maintenance.
ABOUT CRYSTALLOIDS
Crystalloids help companies improve their customer experiences and build marketing technology. Founded in 2006 in the Netherlands, Crystalloids builds crystal-clear solutions that turn customer data into information and knowledge into wisdom. As a leading Google Cloud Partner, Crystalloids combines experience in software development, data science, and marketing, making them one of a kind IT company. Using the Agile approach Crystalloids ensures that use cases show immediate value to their clients and frees their time to focus on decision making and less on programming.


%20(1).png?width=75&height=75&name=Contact%20Services%20(800%20x%20800%20px)%20(1).png)
